Technical information, news, research, and opinion on avalanches, snow safety, and winter backcountry travel.

Wednesday, November 30, 2011

Leverage

Once upon a time we fell apart, you're holding in your hands the two halves of my heart—Coldplay


AUTHOR'S NOTE: I've been slowly refining my thoughts on complexity over the last few posts. This should be the most useful summary so far. ( Post 1, Post 2. )

Perhaps unbelievably, you can use complexity to your advantage. Think of it this way: the more you know, the more you realise what you don't know. I was at a talk last year given by a famous researcher who summed up his career thus far in a few words: "In retrospect, it's clear that most of my career was spent learning how much I didn't know." ( Summary is mine. )

There is an on-going revolution in science that involves breaking down walls between departments in favour of multi-science approaches. In biology, this involves hiring computer programmers and statisticians. In the geosciences, it involves hiring psychologists and graphic artists. You get the idea.
 After pondering for a few years, I'm going to propose a theoretical set of conditions that apply to learning about the avalanche problem. Rather than feeling confused—and I've certainly spent as much time as anyone dealing with confusion—I have come to believe that it's far easier to simply acknowledge the complexity ( and start dealing with it ).

Complexity is a great starting point. It nicely encapsulates the avalanche problem in simple terms that most people understand. By themselves, the scientific models of these systems are not terribly complex, but complexity arises when the systems begin to interact. Therefore, complexity describes the key difficulty involved in learning the science behind both the phenomena and the interactions of the phenomena that ultimately create a new system.

Read this thread on turns-all-year that discusses the complexity of accident formation. Again, by complexity, I mean novel phenomena, de novo outcomes, and small changes having significant affects.

Figure 1.1. Simulation of wind encountering a very simple mountain barrier. Consider the effects of turbulence. What might you see in actual mountain terrain?

wind rotor simulation from Lundeee on Vimeo.

Figure 1.2. Time-lapse of clouds, mountain, and sunlight. The lapse allows us to see the scale and complexity of the phenomena. What patterns would you expect to find based on the prevailing wind direction?

Figure 1.3. Time-lapse of clouds, mountain, and sunlight around Pike's Peak, Colorado, United States. The lapse allows us to see the scale and complexity of the phenomena. Notice how the patterns of light and shadow from the clouds defy simple descriptions of solar input by aspect. Can you imagine the complexity of the heat flux in this environment?

Figure 1.4. We're complex too.

Figure 1.5. Transcription and translation. It's amazing that this even works, but remember, we're complex too.

Figure 1.6. Cognition. My mind, it's blown.

Strategies

Let's start with a set of concepts that work in both the theoretical and applied spaces. ( In this example theoretical and applied spaces means: "people who think about it, people who do it, and people who think about it and do it". )

The concepts are as follows:

1. The mountain environment is a system of complex phenomena.
2. We are a system of complex phenomena.
3. Various scientific models promote awareness of these phenomena.
4. The interaction of these complex phenomena forms another system.
5. Theoretical and applied models of the whole system are missing1.

Current strategies for managing the complexity inherent to the avalanche problem:

1. Rules are an appropriate simplification of complexity.
2. The public avalanche bulletin is an appropriate simplification of complexity.
3. Uncertainty is an appropriate simplification of complexity.


Figure 1.7. Other strategies for managing situations of varying complexity. This framework presents several levels of complexity and suggests a different approach for each situation.


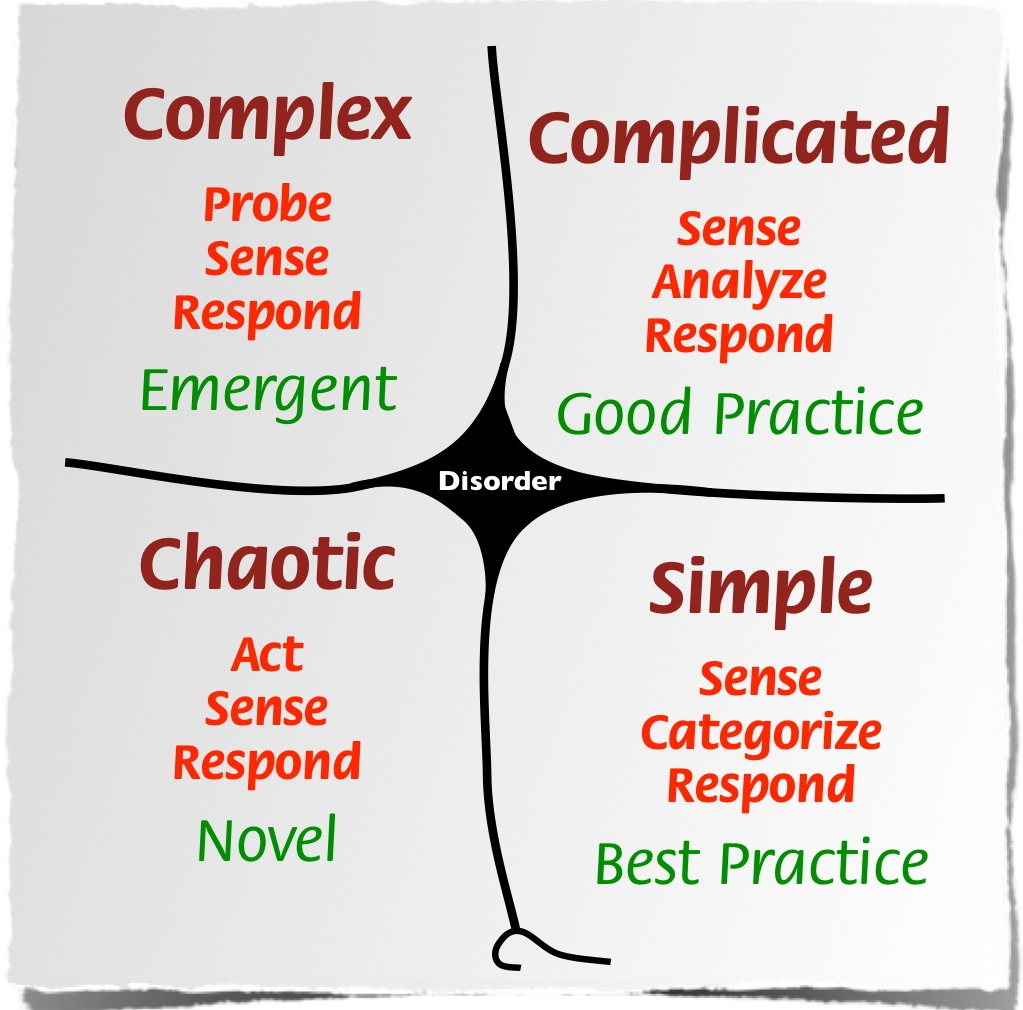
Figure 1.8. A video explaining how the model works. The framework's designer says that we approach situations with our default viewpoint, and this leads to bad decisions. Instead, we should evaluate the situation and choose the best approach rather than what we prefer.


Does anyone else's brain hurt?

1 The avalanche triangle is a great model but it does not formally address complexity.

Tuesday, November 29, 2011

Simplification

With friends surrounded, the dawn mist glowing, the water flowing, the endless river, forever and ever—Pink Floyd

AUTHOR'S NOTE: The last post was complicated and rambling, so I'm going to present a careful simplification. I also feel the need to explain something else: for a long time I've written about uncertainty and some people have asked about alternatives. So, if you think uncertainty is too general, you get to deal with complexity instead.

1. Natural phenomena are fundamentally complex.
2. Scientific models of the phenomena are not particularly complex.
3. Mixing in the scientific models, as with mixing in the real world, introduces complexity.
4. Complexity in the models is simply a reflection of the original, irreducible complexities.

We're told again and again to use multiple observations before making decisions. Surely this means that a systems understanding is the best approach to mountain safety. One way to approach it from a systems level is to simply acknowledge the incredible uncertainty, but there are other approaches.

You can approach the problem from the perspective of thermodynamics. Is this a requirement? No, but some people prefer this approach. You can approach the problem from the perspective of psychology. Is this a requirement? No, but some people prefer this approach. What about a risk management approach? Rule-based approaches?

Clearly there are numerous approaches, and if we follow the rule of multiple observations, then it's obvious that we need to use techniques from each area.

Of course new complexities arise as soon as we start mixing the models of thermodynamics, psychology, and uncertainty.

And you've already heard that story, right?


NOTE: There are great new features from http://www.hillmap.com/. Please read this post on Turns-All-Year for instructions on using this exciting product.

Monday, November 28, 2011

Integration

At a higher altitude the flag unfurled, we reached the dizzy heights of that dreamed of world—Pink Floyd

AUTHOR'S NOTE: A few weeks ago, I wondered what was behind my recent spate of posts. After some reflection, it's clear I've been searching for a theme for the 2011-2012 ski season. Past themes have included uncertainty and psychology, but this year I'm going to write about complexity. Very often complexity is managed by breaking things down into constituent elements. As we shall see, this has benefits and drawbacks.


This post compares simplicity with complexity; specifically whether or not it is desirable, possible, or necessary to simplify complex information. This post will require significant patience, so if you're not feeling patient ... please come back when you are.

Experiment #1

Maybe you don't often think about linguistics, but it's pervasive, and you rely on linquistic techniques every time you read, write, and communicate. In this experiment, we're going to borrow a few tricks from linguistics and engage in a thought experiment or two. Consider the following sentence:

  • The snow is between the sky and the ground.

Figure 1.1. The sentence is a system composed of individual elements ( called words ) and we could say that meaning emerges from the system. Spend a moment thinking about alternate word arrangements. While you're at it, take a long, hard look at the sentence and see if you can extract additional meaning from the arrangement of the words. Does rearrangement affect your perception?
  • The ground and snow are below the sky.
  • The sky is above the snow and the ground.

Figure 1.2. What about removing individual letters? Sometimes it matters and sometimes it doesn't, but having not seen the original, how many people can reconstruct the original phrase from the phrase below?
  • The now is betwen he ky an te grond.

Figure 1.3. If removing letters doesn't work very well, what about reducing the system to its constitutent elements? You can still extract meaning from the individual words, and it may be possible to extract a general concept from the words themselves. But ask yourself, do the individual words have the same meaning as the original or has something has been lost in the simplification? How would you describe the change in meaning for this diagram?
  • And
  • Between
  • Ground
  • Is
  • Sky
  • Snow
  • The

Figure 1.4. What about the individual letters? Do you feel like this representation is much simpler than the original sentence? If so, you can test the hypothesis by comparing the time required to memorise the string of letters with the time required to memorise the original phrase. One thing we can say for sure is that the original meaning has been lost entirely. Still, the individual letters are very easy to understand in the sense that you know what the letters themselves represent. How would you describe the change in meaning for this diagram?
  • A, B, D, E, G, H, I, K, L, N, O, R, S, T, U, V, W, Y

Figure 1.5. I hate to take you back to grammar school, but this is a diagram of the sentence. It's another model of the system and it gives you an idea of how to simplify the system in a way that preserves its essential meaning: snow between sky and ground. If we want an even simpler representation, we can use the following: sky snow ground. In this case, we've kept the three essential nouns and we're encoding the position of the snow ( between ) in the structure of the phrase itself. Neither simplification constitutes a proper sentence, but we aren't interested in grammar at the moment. As it turns out, the really essential elements are three nouns, but counter-intuitively, adding an adjective and a conjunction significantly increases understanding. All this might sound nutty, but you probably do it almost every day. How many times have you revised an email and wondered if you're still getting your point across? Do you add or remove information to simplify and increase clarity? My guess is that you do both.


Off The Philosphical Deep End

Well not really, but here's a question that seems very philosophical: why does writing work? How is it possible to take 26 characters and produce the works of Shakespeare, The Avalanche Handbook, and this blog? The science of physics provides a very reasonable answer.

Writing works because of a concept called mixing. The origin of mixing depends on who you ask, but classically, mixing is used to describe irreversible processes such as mixing ink in water or mixing vodka, water, and vermouth. Literature, which is an execellent example of complexity in its own right, emerges from the alphabet because we can mix the letters into words, we can mix words into phrases, and we can mix phrases into sentences. You can even mix letters and make up your own words, which might sound a little ridiculous, but it happens every day.

But anyway, this is where scale comes in.

In addition to the concept of meaning, we are also working with the concept of scale. Where is meaning encoded? At the scale of a sentence, clause, word, or letter? Actually, meaning is encoded at all scales. A is not the same as B just as apple is not the same as bat and I like apples is not the same as I like bats. Yes, you can file this under useless philosophical controversies, but it's quite true nonetheless.

This blog post also exploits mixing. Not only am I mixing letters, phrases, and words into a novel work, I am also mixing concepts from linquistics, physics, mathematics, and meteorology. But let's go back to the word exercise for a moment: you can see that simplifying a system doesn't always make it easier to understand.

So, why is that?

When you simplify something, you create something novel, and there is a very significant chance that new complexity will emerge from your novel creation. In many cases, the complexity that arises from simplifications actively prevents clear understanding. Sound like a stretch? Go back to the sentence experiments and do them again.

Or just ask yourself how many times you've requested clarification from the author of a five word email.

Experiment #2

This experiment is designed to test your patience ( and powers of observation ).

Figure 1.6. Watch this video of the environment, but pretend that it's snowing and you have magical binoculars that allow you to see through the storm. Rather than thinking about terrain, snowpack, and weather, just think about the environment containing the terrain, snowpack, and weather. The interaction between the systems produces remarkable variations.


Write three words that describe what you've observed. Mixing makes things quite complicated, doesn't it? Three words aren't quite enough? Alright then, start by explaining the phenomena you've observed with a single sentence of up to 10 words. If that's not enough, then feel free to use a paragraph. If you still feel constrained, use three paragraphs: introduction, body, and conclusion.

Samples

Here are several sample models of the phenomena at play. Mixing is represented by the arrows, and the on-going nature of the phenomena are represented by the continuous cycle diagram.

Figure 1.7. Here's my three word version of my observations from the video. You'll notice that it's wrapped up in a conceptual model that integrates the elements. I spent a week thinking about this and actually consulted several outside experts. By itself, this model is very easy to understand. But as in the real world, the factors in this diagram are mixed with the factors in the following diagram.


Figure 1.8. Here's a model of what's going on in the snowpack. Again, by itself snow metamorphism isn't particularly difficult to understand. And again, complexity arises because the factors in this diagram are mixed with the factors in the preceding diagram and the following diagram.


Figure 1.9. Here's a model of what's going on with the weather. When viewed alone, these weather trends are very easy to understand. But again, complexity arises because weather factors are mixed with factors from the preceding diagrams. This means that, ultimately, the direction of instability corresponds to the magnitude, rate, and duration of each factor, which is determined by a complex mix of other factors ( and so on ).


This post probably seems a bit strange, but I want to make a point.

Simplicity and complexity are not mortal enemies. They're not at opposite ends of a spectrum. In fact, comparing simplicity with complexity is like comparing apples and oranges. As a backcountry skier, it's important to ask yourself if you really understand the sources of complexity.

HINT: It's not the science.

Spindrift

I was in a similar situation once in British Columbia. Nothing as dramatic as the video below, but it was scary. No wonder I hate ice climbing.

Video:


Full story:

http://willgadd.com/?p=600

Tuesday, November 22, 2011

Fast Thinking

Daniel Kahneman is an incredible thinker. If you have interest in "human factors", this video is a must see.

http://www.guardian.co.uk/commentisfree/video/2011/nov/21/daniel-kahneman-psychology-video

Monday, November 14, 2011

Northwest Snow & Avalanche Summit Download

On Sunday, I gave a presentation at the Northwest Snow & Avalanche Summit.

Here's a link to the presentation.

Friday, November 11, 2011

In Honour of Monika Johnson

Glowing Sun, Bright Sun—Sigur Ros

From turns-all-year.com:

Our community suffered a huge loss last year when Monika Johnson broke through a cornice on Red Mountain, February 1st, 2011. In her honor, a group of her good friends and family have started The Monika Johnson Avalanche Education Scholarship, a.k.a. The Yuki Awards.

Learn More at Turns-All-Year

Tuesday, November 8, 2011

REI Avalanche Safety

If you could read my mind, what a tale my thoughts would tell—Gordon Lightfoot

REI has an interesting feature on avalanche safety. My criticism in a single sentence: it's a disconnected collection of "rules of thumb" punctuated by errors, some of which are significant. It's clear the authors know something about snow safety... but... not quite enough.

From the first page in the series:

During winter, a south–facing slope is more stable than a north–facing one since it has sun exposure to melt and condense the snow. The tempting north–facing slopes that hold all the best powder are also more likely to have unstable layers of ’depth hoar,’ the dry, icy snow that does not stick to the adjacent layers. Since these slopes don't have the benefit of sun to warm and compact the snow over the winter, they tend to be less stable than south–facing slopes.

This is not true. Instability can develop on any slope, at any time during the winter. In fact, The Avalanche Handbook, citing research by Grimsdottir, plainly states that, after accounting for slope use patterns, aspect is a poor predictor of avalanches. You should never use aspect by itself to judge instability, and the beginners at whom this article is clearly targeted need to know this more than the experts.

Also from page 1 of the series:

A common crystal type that is particularly dangerous due to its inability to bond with other snow crystals is know as ’hoar.’ Hoar snow, also called ’sugar snow’ because of its similarity to granulated sugar, can be found at any depth or at multiple depths in a deep snowpack.

"Hoar" isn't really the correct term. The author should refer to facets, surface hoar, and depth hoar, or refrain from using any terminology except for "sugar snow" or perhaps "coarse snow". The other problem is that very fine layers of facets ( such as facets above or below a crust ) can be very easy to miss. The difficulty in identifying thin weak layers should be noted in the article.

Also from page 1 of the series:

Snowstorms pile up one after the other all winter long. Wind blows snow off of some slopes and on to others. Temperature changes cause snow crystals to metamorphose. If the snow’s consistency remains constant, the snowpack is homogenous and stable. It’s when the snowpack develops different layers of different snow types that it becomes unstable and hazardous.

This paragraph started out so well... Unfortunately, the statement about constant consistency being an absolute measure of "stability" is entirely wrong and dangerously misleading. First, snowpack evaluation is framed around the search for instability, and second, a beginner should not judge the stability of the snowpack by consistency alone because it is very easy to miss important signs of inconsistency. Better to err on the side of caution if you just don't know.

From the second page in the series:
  1. Dig a pit 5 feet deep or to the ground (whichever comes first) on an open slope after probing to see if there is any old avalanche debris, rocks or brush in the way. Make the face of the pit smooth with your shovel.
  2. Use a glove to brush the surface of this wall to see if there are visible layers.
  3. Use a credit card or driver’s license and, holding it lightly, slide it down the wall. Notice where the card catches on hard layers.
  4. Do the same starting at the bottom and sliding up.
  5. Next, do a finger test for soft layers, running your gloved hand first down and then up the wall. Note where the hard layers (possibly sun or wind crust) and the soft layers (depth hoar) are located.
  6. If you don’t detect any significant layers in the snow, you can continue on your trip. But if there are crusty or soft layers, you should then perform at least one of the following tests.
This isn't really the correct procedure for performing a snow profile, although it clearly tries to communicate the right information. Use a driver's license or credit card? It would be better to provide an explanation of how to excavate the profile and use simple tests to evaluate layering and determine if hardness increases with depth. There is a very strong relationship between data sampling and perception of instability, and the rudimentary tests discussed here could miss important details. It's better for most recreational backcountry skiers to avoid formal profiles and focus on snowpack tests instead ( which are outlined on the page ).

Also from page 2 in the series:

The Rutschblock test is fairly reliable in predicting fracture initiation (how much force is required to start an avalanche). The Extended Column Test has become more popular because it not only predicts fracture initiation, it includes fracture propagation (how big the avalanche might be). The ECT is also easier to perform since the size of the isolated block is smaller.

Shear quality analysis derived from rustchblock tests can also provide valuable information about fracture propogation. It is worth mentioning that the ECT most certainly DOES NOT predict avalanche size, and even if it did, most people are killed by small avalanches that don't travel very far.

Also from the page 2 in the series:

If you have to jump in the middle of the block, there’s likely a low chance of avalanches on slopes with similar angle and aspect.

This is only true if you ignore spatial variability.

Also from the page 2 in the series:

A Q1 shear is of more concern to the backcountry traveler than a Q3 shear.

First, this is non-information, and second, after spending most of the page discussing how to perform snowpack tests, the author neglects to discuss the importance of shear quality. Not only that, but Q1 and Q2 shears have roughly the same importance with respect to skier-triggered avalanches. Here's the skinny on shear quality for beginners: if you observe shears that are rapid, sudden, or smooth, then you have uncovered a clear sign of snowpack instability.

Anyway, I want to be clear that this is not an attempt to criticise REI, but at the same time, it would be very easy for REI to check this information with a local guide service.

Friday, November 4, 2011

Northwest Snow & Avalanche Summit

Have you heard about the Northwest Snow & Avalanche Summit? Hosted by Michael Jackson, there will be speakers, presentations, food, and lots of talk about snow avalanches. I'll be there giving a short presentation, but you should really come and see Garth Ferber, Karl Birkeland, Rod Newcomb, and Karl Klassen.

http://www.brownpapertickets.com/event/199594

There are some tickets still available, but it is unlikely that any will be available at the door. Feel free to come say hello, especially if you happen to have spare cookies!

Wednesday, November 2, 2011

Knowing, Part III

I get this feeling I'm in motion, a sudden sense of liberty—New Order

In the last few posts I've made a lot of noise about sources of uncertainty, and I've tried to illustrate the science behind the uncertainty. In this post, I'm going to try and illustrate things that can be measured accurately.

CAUTION: These are research images, and as such, they are not suitable for route selection, navigation, or any other "real world" application. I have presented similar maps in another blog post, but those maps intentionally have certain features removed to preserve uncertainty. These maps contain statistical analysis that can significantly alter your perception of the terrain therein.

Figure 1.1. This is a map of avalanche terrain, non-avalanche terrain, convex, and concave surfaces for Asulkan Valley, Glacier National Park, British Columbia. I think the variations are fairly obvious. These notes are a few years old, and yet the concept of variations underlies the discussion.


Figure 1.2. This is a map of cumulative slope angles for Connaught Creek, Glacier National Park, Canada. The cumulative slope angle provides a rough index of several variables: avalanche terrain, surface area, and overall exposure.


Figure 1.3. Map of avalanche terrain at Avalanche Crest, Glacier National Park, Canada. For the regions enclosed in red-lines, varying degrees of avalanche terrain are indicated with red shading. Non-avalanche terrain is indicated with blue shading. ~70-90 percent of the terrain in the upper regions is avalanche terrain.

The distribution of avalanche terrain shows us why avalanches from the huge, central start zone do not reach the Trans-Canada highway; non-avalanche terrain below the bowl creates a runout zone. In several cases, the presence of known runouts correlates exactly with large patches of non-avalanche terrain.

Runout locations are often found on areas with very light blue or almost white patches. ( Correlation verified with terrain rating materials from Parks Canada. ) Additional small patches of non-avalanche terrain below the planar start zone probably serve as runouts for smaller avalanches — and as abrupt slope angle terrain traps.


Figure 1.4. Surface area values in square meters for terrain at Avalanche Crest. The length and width of each cell is approximately the same size ( +/- 3% ). The larger surface area is a factor in start zone formation and density of start zones. The surface area difference between 651,182 and 485,899 is 165,283 square meters; the equivalent of 400m×400m of additional surface area.

Stated simply, large quantities of snow accumulate in the start zone because the surface area is greater by almost 1/4 square kilometer. Remember, areal size is the same ( if compared on a map ) but surface area in the start zone is much greater because of surface curvature.

Assuming each area is subject to 1-meter of snowfall, weighing 200 kg / cubic meter after metamorphism, accumulation in the runout zone is around 91,000,000 kilograms of snow; accumulation in the start zone is around 130,000,000 kilograms. That's a difference of ~40,000,000 kilograms. In many cases, local wind-effects may cause an increase or decrease in snow supply but this is impossible to measure at present.


Figure 1.5. Statistical analysis that compares cumulative slope angles from model runs to distribution curves taken from terrain rated by humans. The distribution curves are derived from statistics of terrain that has already been rated. This approach is best described as "nearest neighbours". At the time this image was prepared, I had not yet completed the statistical modeling for "Simple" or "Challenging" terrain. The final distribution curves closely matched my speculative sketches.

Knowing, Part II

I was just guessing at numbers and figures, pulling the puzzles apart—Coldplay

( AUTHOR'S NOTE: This is the nine-thousandth post that addresses the general question of Why Is It So Complicated? While teaching often involves simplification, it's important to remember that you can also use complexity to teach. Despite conventional wisdom, complexity is not always the enemy of simple, and simplicity does not always improve understanding. This post is not meant to be a primer on statistics; it is an attempt to use simple statistics to illustrate the complexity of avalanche problems. Finally, this post does not apply to professional avalanche forecasters because they possess a.) a giant mental database of distributional information, b.) detailed information about the current situation, c.) access to high-end computer models, d.) extensive knowledge about the interaction of terrain and weather in the forecast areas. )

The question: why should we avoid speculating about whether or not data from one location can be used to estimate values at another location and simply acknowledge the uncertainty instead?

Do you really want to know? Here's an answer that goes a bit deeper than "because". I'd like to think that this answer goes all the way to the bottom of the rabbit hole, but unfortunately this particular rabbit hole is very deep.

Introduction
When we discuss avalanches, we often talk about observations. When we discuss observations, we are talking about data. Maybe it's wind speed and direction or precipitation intensity. Or maybe it's shear quality and cracking. Either way, we most often relate the data to a specific place, which is a process referred to as spatialisation. Places are described with a frame of reference such as aspect, elevation, or perhaps something as simple as a name.

Now, let's think of the observation as a single sample at a single point in space. Most of us are immediately curious to know whether or not we can use the data to estimate values for another location. With backcountry avalanche forecasting, the answer is usually no, and a fairly simple principle outlines the complexity:

variations = uncertainty

There are variety of words that describe variations, including homogeneity, heterogeneity, variance, invariance, isotropy, and anisotropy, but we'll just stick with variations for the time being.

Examples
Don't worry these figures, and the accompanying text, make my head hurt too.

Figure 1.1. Consider the terrain shown below. It's not really perfectly flat, and its surface is composed of different materials. However, there are some important ways in which variations in the terrain are low: the maximum difference in elevation is small. But even with such a simple shape, the interaction between terrain and weather still produces a chaotic arrangement of snow depths, drifts, crusts, and weak layers.

With that in mind, can we use a data sample from one location applicable to estimate the value of data at another location? Provided you can account for a significant degree of uncertainty, including the randomness inherent to the chaotic/complex system that produced the snowpack, then yes, you can use data from one location to estimate the values elsewhere.


Figure 1.2. The next example shows some mountainous terrain. The variations in the data are fairly obvious: the maximum difference between elevation values is much greater than in Figure 1.1. These variations create other variations such as orientation to the sky and orientation to wind. ( Which is similar to "propogation of uncertainty" in formal statistics. )

Start to imagine how these variations affect our ability to use a value taken at point A to estimate the values at points B and C. We have our frames of reference such as aspect, elevation, and temperature, but these are simply ways of sorting the data into buckets. A frame of reference can simplify how we perceive the data, but a frame of reference does not reduce the frequency of variations, nor their magnitude.


Figure 1.3. Here's a histogram of the elevation values in the second image ( blue ). You'll notice the magnitude and frequency of variation are statistically significant. Remember, the key equation is variations = uncertainty.  If it's of interest to you, the standard deviation is ~210, which is quite a large value for this data set. The histogram for the first image ( red ) has been fit into the same graph. There is much less variation.

Despite the variances, it's important to note that the data set itself is relatively stable. This simply means that, for our purposes, the values in the set aren't going to change very much in our lifetime. This is why experienced avalanche forecasters often say that terrain is the solution to a dirty snowpack. The stability of the data set reduces certain types of uncertainty.


NOTE: I'm going to make an important point about "making things simpler" and about the dangers of using speculation to estimate the value at two locations from a single piece of data.

Figure 1.4. So we've got a complex problem... we need to simply things... right? The thing is, simplification often has incredibly serious side effects, some of which are outlined in this example. This image shows an accurate simplification of the terrain produced with combination of mathematics and computer science called computational geometry.

Accuracy of the simplification aside, if we look at the image and consider the data at each point, it's immediately clear that a lot of data are missing. Missing data doesn't tend to make things easier, and in some cases it can be downright dangerous. Remember, simplification removes data, so while everything in the model is simpler, our picture is far less complete. Can we fill in the gaps?

There are hundreds of ways to accomplish this using everything from basic math to empirical statistical approaches. Do you favour linear interpolation? What about inverse distance weighting? Kriging? Unfortunately, even if the accuracy of the approach is reasonable, so much uncertainty remains that the simplification doesn't really help very much. Here's why:

Very often, simplification helpfully reduces data while unhelpfully introducing novel variations that are difficult to measure ( which increases uncertainty ). Simplification can reduce complexity, but only when implemented with fanatical attention to detail. This requires to understand all the details and side-effects of your simplification in a way that you can quantify to a high degree of accuracy.

Otherwise, you will certainly end up with less data, but new uncertainties will propogate through your "simplified" model. Think of it this way: before, you were uncertain ( but you knew why ) and now you're uncertain ( and you don't know why ). Imagine trying to use your brain to take the value of A and accurately determine the values of B and C. Does it still seem like a good idea?


Figure 1.5. This is a map of the drainage network for the terrain near Crystal Mountain Ski Resort. For the purpose of illustration, pretend for a moment that this is a map of wind directions that accurately depicts wind flow over rough terrain for a single second during a five hour storm. ( A sampling rate of 1:18000, which is laughably low. )

If you want to imagine what this would actually look like during our hypothetical storm, think about each arrow rotating and increasing/decreasing in size. However, in a rather beautiful paradox, even if you could somehow make the wind flow simulation accurate ( which you can't ), you'd still be wildly uncertain about actual snowfall amounts.

Of course, the next step involves adding clusters of snow crystals to the simulation, and suddenly it would be nice to have a supercomputer. This obscene complexity is simply business as usual for complex systems such as weather and its interaction with terrain. This image makes it pretty clear why local snowfall accumulations often have a variance of 1:10. Ten times more accumulation at point A than point B.


Figure 1.6. Don't worry, it gets worse! This is an overhead map of "Cement Basin" near Crystal Mountain Ski Resort, Washington State. This map shows ground cover such as trees in black, and open areas in white. Surface hoar forms best in areas with a clear view of the sky ( white ). How do ground cover variations effect your perception of where surface hoar forms?

What about variations in crystal size? Think about the gray areas where surface hoar crystals are small, but still connected to areas where the crystals are large. Do you think it's possible to figure out a safe route, or are the variations simply too complex? Are you sure of your ability to collect empirical estimates, or would you rather accept the uncertainty ( and deal with it )?


Variations Are a Fact of Life
Can we overcome the uncertainty inherent in data with large variations? Unfortunately, in the context of backcountry avalanche forecasting, the short answer is that we can't, and managing this inherent uncertainty is what professionals refer to as managing the risk. While this sounds vague, managing the risk includes reducing exposure to variation in order to reduce the amount of uncertainty.

And fortunately for us, it's utterly trivial to reduce exposure to variation.

Figure 1.8. This is a map of "Cement Basin" near Crystal Mountain Ski Resort, Washington State. This is a tiny drainage, but it still contains significant variation, and it's certainly a very easy place to get injured or killed in poor conditions. So, whether you're new to the backcountry, or an old dog in search of an easy day, always remember that you can reduce variations by choosing very small slopes. Just don't let the size of a slope lull you into a fall sense of security.


Geostatistics
Empirical solutions to the problems discussed above belong to a domain called geostatistics ( which is one of my professional interests ). I can rattle on about this domain all day long if you wanted, but I still won't be able to give you any clear answers, and I'm pretty sure you don't want me to rattle on all day.

The clear answer is that interpolation of spatial data derived from chaotic/complex systems is extremely tricky business. That's why this problem has been boxed up nicely inside the concept of spatial variability. Yes, there are things you can know: research has established that there is less variability to shear quality than the number of taps applied during a snowpack test. You can also know the general character of new snow amounts or precipitation intensity.

But it's important not to confuse hard data with speculation. Very often, it's easy to take hard data and try to apply it elsewhere without accounting for the uncertainty that comes with natural variations. This is when science becomes speculation, and while speculation isn't inherently wrong or dangerous, there are definitely situations when it can lead you down the garden path to somewhere you don't belong.

And you can be certain of that.